Each project within CHS used a different approach to develop the joint probability model for selection of storms and extreme value analysis of storm responses. Data from each project was produced in a statistical context that span practical probability space (1 year to 10,000 year return periods).
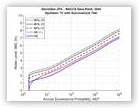
USACE North Atlantic Coast Comprehensive Study (NACCS)
- 1050 Synthetic Storms
- 100 Historical storms
- Over 20,000 save points
- Winds and Pressures
- ADCIRC / STWAVE
- Base simulations (No tides, no sea level change)
- Base + Linear superposition of 96 random tides
- Base + Random or Historical Tide simulations (One tide per storm, no sea level change)
- Base + Random Tide + Sea Level Change 1.0 m (One tide per storm, sea level change 1.0m)
- Statistics
Annual Exceedance Probability (AEP)
Storm Recurrence Rate (SRR)
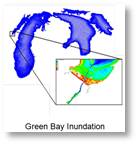
FEMA Region V Great Lakes Coastal Flood Study
- Lakes Michigan, St. Clair, Huron, Ontario, Superior and Erie
- ~ 150 Historical storms 1960-2010
- Over 10,000 save points
- ADCIRC / STWAVE / WAM / SWAN
- Winds and Pressures
- Statistics
Annual Exceedance Probability (AEP)
Storm Recurrence Rate (SRR)
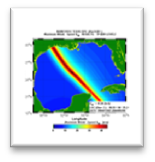
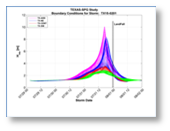
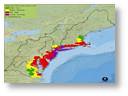
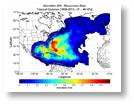
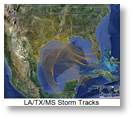
USACE Texas / Louisiana / Mississippi
- 892 Synthetic storms modeled
- Historical storms: Allen, Bret, Carla, Ike, Rita
- Over 7,000 save points
- ADCIRC / STWAVE
- Statistics
Annual Exceedance Probability (AEP)
Storm Recurrence Rate (SRR)
Read More (Louisiana / Mississippi) ...
Read More (Texas) ...
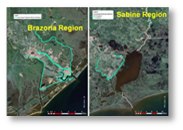
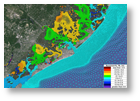
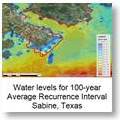
USACE Sabine to Galveston (S2G)
- Base Conditions with and without Project
- 61 Tropical Synthetic storms modeled
- Over 4,000 save points
- ADCIRC / STWAVE
- Statistics
Annual Exceedance Probability (AEP)
Storm Recurrence Rate (SRR)