About CHS
The Coastal Hazards System (CHS) is a national-scale effort for the quantification of coastal storm hazards and distribution of Probabilistic Coastal Hazard Analysis (PCHA) results and statistics. The main components of the CHS include the PCHA, data repository, web-tool for easy access to results, and website containing documentation and metadata. The PCHA is an innovative framework integrating comprehensive characterization of regional storm climatology, advanced joint probability analysis, high-resolution atmospheric and hydrodynamic numerical modeling, and cutting-edge machine learning techniques and metamodels.
Data distributed through the CHS include numerical model output and hazard curves for storm surge, waves, currents, wind, and rainfall fields associated with tropical and extratropical cyclones. These hazard curves represent the magnitude of the hazards as a function of their annual exceedance frequency (AEF) along with corresponding uncertainties. The CHS provides a centralized location for PCHA data to support feasibility studies, economics analyses, evaluation of nature-based features, stochastic engineering designs, and risk and resilience assessments.
Why CHS
Flood and wind damage from annual coastal storms continues to cause dramatic negative impacts to the U.S. economy with direct cost of over $530 billion for the top 5 hurricanes. Four of the top five most damaging storms have occurred since 2011. Over 40% of the U.S. population in 2010 lived in coastal watershed counties, with an increase in 10% by 2020, even though those coastal areas account for less than 10% of the total land in the U.S. Sea level rise and increasing storminess are exacerbating the vulnerability of coastal communities. Hurricane Sandy alone accounted for roughly $75.4 billion in damages and Hurricane Maria for over 2980 deaths.
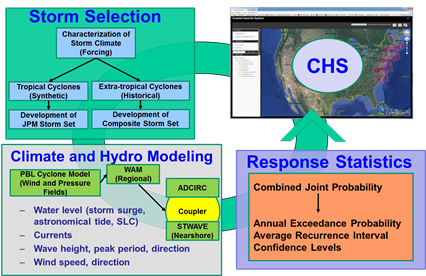
Following Hurricane Katrina in 2005, both the Federal Emergency Management Agency (FEMA) and the US Army Corps of Engineers (USACE) embarked on a new strategy to employ high-fidelity numerical climate and hydrodynamic modeling, and rigorous joint probability methods, to quantify the hazard due to coastal storms. Over the last 15 years these methods have been developed to quantify the hazard for all U.S. coastlines exposed to tropical storms. The graphic below illustrates the strategy for conducting regional high-fidelity modeling studies and populating the Coastal Hazards System. For more information on the framework, see Norberto C. Nadal-Caraballo, Madison O. Campbell, Victor M. Gonzalez, Marissa J. Torres, Jeffrey A. Melby, Alexandros A. Taflanidis (2020) Coastal Hazards System: A Probabilistic Coastal Hazard Analysis Framework. Journal of Coastal Research, 95(sp1), 1211-1216, (26 May 2020) https://doi.org/10.2112/SI95-235.1
What Does CHS Provide
Modeling Results
- ADCIRC
Peaks and Time Series of the following parameters surge, water level, tides, current speed, current direction, wind speed, wind direction - STWAVE/SWAN/WAM
Peaks and Time Series of the following parameters significant wave height, peak period, mean direction, water level, wind direction - Storm Conditions
minimum central atmospheric pressure, far-field atmospheric pressure, storm track location: latitude and longitude, heading direction, storm speed, radius to maximum winds, Holland B
Statistics
- Storm Relative Probability
Response Average Recurrence Interval (ARI): 1, 2, 5, 10, 20, 50, 100, 200, 500, 1000, 2000, 5000, 10000 years
Uncertainty: expected value, 84%, 90%, 95%, 98% confidence limits